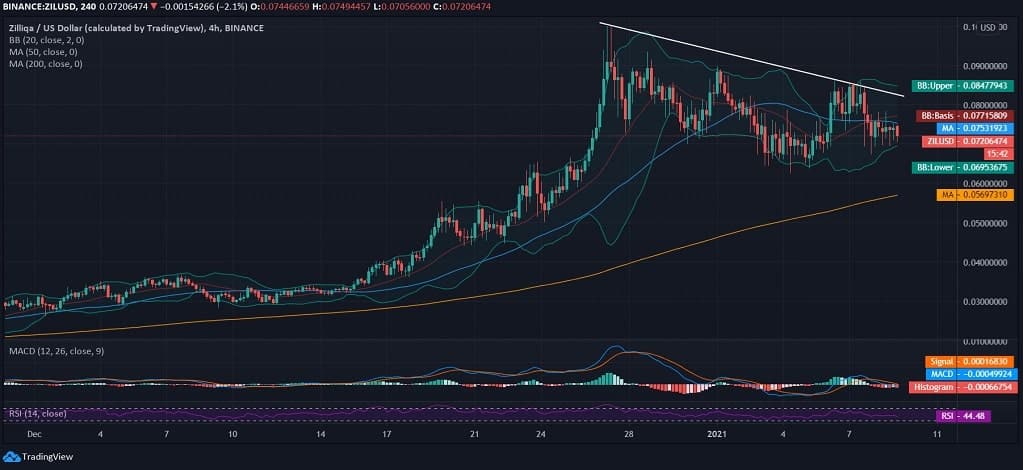
Zilliqa maintains its stance amongst the top 45 cryptos of the market even though it corrects downsides after breaching over 2-year resistance and losing traction thereafter. ZIL/USD lost the winning snap and drew a bearish crossover after it confirmed an extended downtrend on the 4-hourly chart from the high of $0.100 to dropping at $0.0623.
ZIL/USD was below $0.080 when it lost support from the 50-day 4-hourly moving average and regained after it strengthened to currently trade at $0.0720 and is 3 cents close to regaining 50-day MA at $0.0753.
Zilliqa that was trading below 45th rank in the global crypto market, has now leaped to trading on the 43rd rank after gaining enough social media impetus and amplified market capitalization. As per the recent Zilliqa price prediction, the currency is now one of the most preferred investment avenues and altcoins amongst the many top viz., Ethereum, Cardano, Stellar, and BNB coin.
Zilliqa Price Analysis
At the press time, Zilliqa price was seen joining dot for the continued downtrend that started right after the coin ditched the bullish sentiment when it breached an approximate of 2-year high at $0.100. The price trend is now inclined towards the lower Bollinger Band as sluggishness hinders on the 4-hourly chart.
With an inclination towards the lower trading range, ZIL/USD has lost support from 50-day 4-hourly MA but retains support from 200-day MA at $0.0569. The MACD chart draws a bearish sentiment due to confirmed pullback leading to trade below $0.080 and losing the medium-term support. The RSI is now extending its inclination towards the oversold region, while currently lies at 44.48.


